HTTP Analyzer IE Add-on Edition v3.0.1.55
16 ноября 2007. Разместил: Eugene
HTTP Analyzer IE Add-on Edition v3.0.1.55
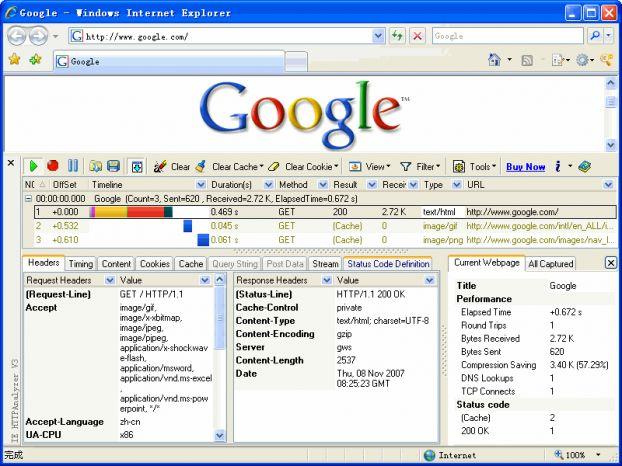
HTTP Analyzer IE Add-in Edition - плагин к Internet Explorer, который позволяет перехватывать в реальном времени HTTP/HTTPS трафик. Программа показывает большое количество полезной информации: заголовки, куки, строки запросов, post-данные, ответы сервера, редиректы и т.д. Данные представляются в удобном виде, с возможностью фильтрации.
Monitor HTTP, Trace HTTP, Debug HTTP, Capture HTTP, Track HTTP and Analyze HTTP/HTTPS!
Main Features
• Real-time Request Level Time Chart, The colored time chart is used to express the relative time between a single network level timing (i.e. , DNS lookup, TCP connects) and other timing segments in the same request. New in V3
• Real-time Multi-level summaries, The summary panel displays the real-time updated summary information on the HTTP/HTTPS requests in a single webpage, a single monitored process or the whole log. New in V3
• Request builder, Users can handcraft an HTTP request by using the HTTP Request Builder, or use a drag-and-drop operation to move an existing request from the session grid to the Request Builder to execute it again.
• Automation interface, The HTTP Analyzer automation library is packaged as COM components. both Stand-alone and Add-on can be fully controlled by using OLE Automation. It can be used by most programming languages (e.g. C#, Delphi & JavaScript).
• Displays Winsock traffic originating from Java applets and JavaScript embedded in a Web page, displays Winsock traffic originating from ActiveX controls and COM objects instanced by an application (Stand-alone Edition Only)
• Support HTTPS, show you unencrypted data sent over HTTPS / SSL connections, HTTPS is available if the application uses the Microsoft WININET API (ex. ie, outlook) or Mozilla NSS API. (ex. firefox, thunderbird)
Version 3.0.1.55 (11/12/2007)
- New: Real-time Request Level Time Chart. The colored time chart is used to express the relative time between a single network level timing (i.e. , DNS lookup, TCP connects) and other timing segments in the same request.
- New: Real-time Page/Process Level Time Chart. The colored bars are used to express the relative timing of requests in the same group ( Webpage for IE Add-on, Process for Stand-alone) and the different phases of an HTTP request, e.g. blocked, connect, etc. It shows directly and visually how a site is performing, which can help the user to find and diagnose the common problems quickly.
- New: Real-time Multi-level summaries. The summary panel displays the real-time updated summary information on the HTTP/HTTPS requests in a single webpage, a single monitored process or the whole log.
- New: Grouping Of Requests By Page/Process. In Add-on Edition, Requests are now grouped by page by default. while in Stand-alone Edition, Requests are grouped by process name by default. Each group can be separately expanded or collapsed. Requests that are grouped can be navigated more easily.
- Improve: Request Builder, In V3, User can use multipart/form-data POST method to upload files (introduced in RFC 1867) and View the response headers and content.
- New: Build-in JSON Viewer The JSON viewer simply shows a tree structure representation of the JSON format. You can use the "Send to JSON Viewer" command in any editor to directly send selected content to the build-in JSON Viewer.
- New: Native Log Files, Smaller and More Information HTTP Analyzer V3 introduced a new log file format (*.halog), Compared to the previous XML version, it has a smaller size, and can record more information. In V3, HTTP Log records will been save as this file format by default.
- Improved: Automation Interface. 1. Summary Information Added to Automation Interface 2. Request Level timings Added to Automation Interface 3. Entry Group (Webpage/process) information Added to Automation Interface
- New: A New "View" menu item has been added to the toolbar and main menu. It contains many appearance options for the session grid View.
- New: Add a "Offset" column that displays an offset in seconds from the first entry in the current group (web page or process)
- New: Add a "Web page" column that displays the web page title of the current request.
- New: Add a "Send to JSON Viewer..." command to popup menu of the content editor to send selected content to JSON viewer to parse the JSON content as a tree structure.
- New: Add a "Font..." command to popup menu of content editor to change the display font.
- New: Re-arrange the command items in the toolbar and main menu.
 Размер: 3.36 Mb
Скачать в UA-IX: HTTPAnalyzerIE_Add_onEdition_v3_0_1_55.zip
Вернуться назад